DERIVING DATA
Correlation
I’d like to overview Pearson’s r, touch upon Kendall and Spearman, and then dive into MIC.
Pearon’s r
This is what people typically think of when they think of correlation. It measures the linear relationship between two variables. If you plot (x, y) pairs and look for a line of best fit to describe their relationship, a $\rho = 1$ would be all the points on a line with a positive slope, and likewise a $\rho = -1$ would be all the points on a line with a negative slope. But is there more to the story than meets the eye?
Well, technically Pearon’s correlation coefficient is the covariance of the two variables divided by the product of their standard deviations. Why do we normalize by this product you ask? Good question! Before I answer that, are we all on the same page on how we calculate covariance? Covariance is the measure of joint variability of two random variables, and is defined as the expected product of each each variable’s deviation from its mean. I like to think of the product of all their deviations as a matrix, and then the expected value is the average of all of those deviation pairs. Is it more common for them to both be positive or negative deviations (above or below the mean, yielding a positive expected value), or are they inversely related (yielding a negative expected value)? We are looking to see if there is similar variance behavior between X and Y.
Perhaps this foregrounds why we’d want to normalize by the standard deviations, as we want to be able to compare apples to apples across X and Y, and want to normalize all the individual products in our cross product in the numerator (where we’re taking the expected value), which we do by taking the product of our standard deviations and putting that in our denominator.
Are there any funny edge cases or strange behaviors of this coefficient? Well, there’s that whole issue of population vs. sample, but you’ve heard that whole spiel before. The expected values mean different things in both of these cases, which changes how we think about standard deviation. It’s worth noting that Pearson’s r is scale and location invariant, but perhaps that feels intuitive if you think about how that scaling will affect the variance, means, and standard deviations of X and Y by constant values, and therefore can be factored out. Perhaps that’s easier to see if you think of taking an X and Y with a $\rho = 1$, and then either applying to constant to smear the line out, or translate it to a new location. These applications of constants will not change the coefficient.
Kendall & Spearman (in-progress)
I think we all generally get that we would be pursuing a non-parametric test because some assumptions of our distribution have not been met, but what’s the rule of thumb here?
Mutual Information Coefficient (MIC) (in-progress)
I’ve always been excited about MIC, and I think this graphic might to why:
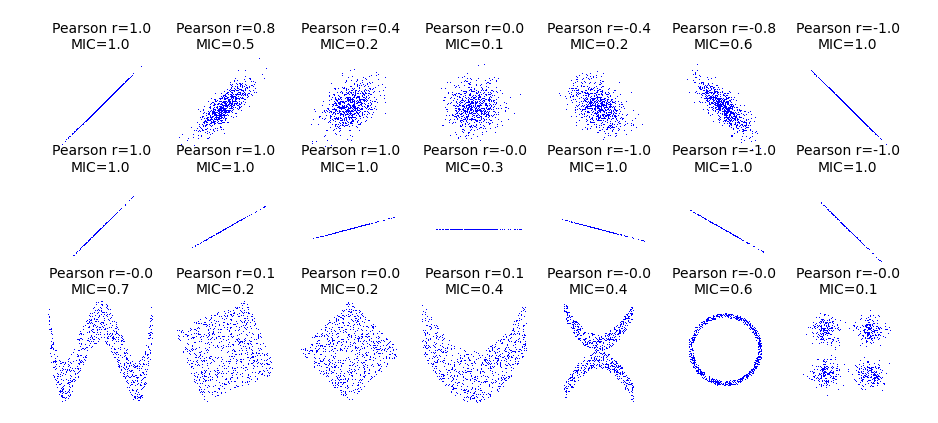
If you take a look at that ring on the bottom row, we obtain a r value of zero, yet there is structure to this data that MIC is well suited to quantifying.